Contents
Preface
The Hypotheses
The final form of the Survey
The Subjects
The Results
A Keeper's Training
Lord Bafford's Manor
Break from Cragscleft
Prison
Down into the Bonehoard
Assassins
The Sword
The haunted Cathedral
The lost City
Undercover
Return to the Cathedral
Escape!
Strange Bedfellows
Into the Maw of Chaos
Further data analyses
Modifications by times played
More analyses
Comments about the Hypotheses
Final Comments
The FAQ for the suvey
|
The Subjects
This page has two parts: In the first are the people who joined the survey described, in
the second one their gaming behavior. In some short words: The protypical subject was male,
worked either with computers or was still studying or at school, was younger than 35 years
old. The prototypical suubject had played the game only one time, prefered the 'Hard'
difficulty mode, and enjoyed to act in the 'Sneaker'-style.
[descriptive facts about the people],
[descriptive facts about the gaming behavior]
Descriptive facts about the people
The survey was filled out by 225 people. A surprisingly large number of subjects for the
short duration of the data collection.
56 people (25.9 %) were younger than 18 years old, 76 (35.2 %) were 18-24, 70 (31.1 %) were
25-34, 12 (5.3 %) were 35-44, and 2 (0.9 %) were more than 45 years old. 9 people had no
age. Of the subjects were more than 93 % younger than 35 years.
The educational degree of the people matched the age of the group, the majority went to
College (25.3 %) or High School (37.8 %). This fact is obvious, somehow: You can't expert of
a normal 18-24 year old person that he had already done the PhD. The educational degrees
were:
no degree |
18 |
(8.0 %) |
High School |
57 |
(25.3 %) |
College |
85 |
(37.8%) |
Master's degree |
15 |
(6.7 %) |
University |
32 |
(14.2 %) |
missing |
16 |
(7.1 %) |
Of the 225 people were 208 male, 9 were female, and 8 claimed had no sex at all.
The occupations of the people could easily be classified into 4 categories: People who were
at school or studying, people who worked with computers (i.e. customer's support, or
programmers), people who did not fill that box out, and people who had other occupations
than school or working with computers.
Student / School |
68 |
(30.2 %) |
Computers |
51 |
(22.7 %) |
Others |
50 |
(22.2%) |
none / missing |
56 |
(24.9 %) |
The category 'others' was created for the purpose to simplify the occupations. Occupations
that were put into this category were: Pastor, Teacher, Kickboxing Instructor, Games
Reviewer, Mag Editor, Restaurant Worker, Engineer, Homemaker, sales, Warehouse worker,
Librarian, Compositor, Nurse, Researcher, Driver, Filmmaker, Writer, Actor, Manager,
Corporate travel, Masonary / Biologist, Military, Game Developer, Artist.
Occupations as 'playing Thief' or similar nonesense qualified the person for the category
'none.'
Descriptive facts about the gaming behavior
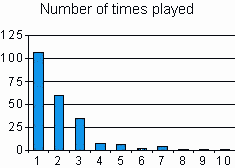
Most of the people had only finished the game one time (107, 47.8 %). Another 60 (26.7 %)
had finished the game two times. Three times it was done by 35 (15.6 %). So, more than 90 %
of the subjects had played the game only for less than 3 times.

(The y-Axis represents the simple N.
That is the number of people, not any
percents.)
I stress this fact so much, because it surprised me very much that the majority of the
people was not a member of the freaks who played the game more often. (I am allowed to call
that group 'freaks', because I am a well-known member of that freaky group.)
Nevertheless, the prefered difficulty mode was 'Hard' (39.6 %) and 'Expert' (36.0 %), and
not 'Normal' (24.4 %) - what I would have expected in a group that had finished the game
only one time.
When I had the first look at the data, I frowned at this oddity, but remembered that there
are indeed people who choose the higher difficulty modi instanstly when playing a game.
The ratings for the prefered esotheric gaming style do not match the fact that the people
had played the game only one time. It is relatively obvious that the people who had not
played the game so often should have choosen the option 'Just matching the mission'. But,
well, they didn't.
Assassin |
34 |
(15.1 %) |
Coward |
7 |
(3.1 %) |
Psychotic Mass-Murderer |
16 |
(7.1 %) |
Sneaker |
79 |
(35.1 %) |
Tomb Raider |
9 |
(4.0 %) |
Just matching the mission |
56 |
(24.9 %) |
Other |
24 |
(10.7 %) |
The huge amount of people who enjoy the sneaker mode has probably two reasons: Firstly, my
definitions of the gaming styles were written by an unobjective person. I defined that style
as my own prefered style. That can explain some of the votes, and others are imbedded in the
sneaksie game design itself - if someone want to frag monsters, he will most probably play
'Quake' or 'Halflife', not 'Thief'. Thief is a game for sneakers.
|


